
Quantitative Reverse Transcription PCR (qRT-PCR) is a widely used technique for measuring gene expression. Accurate normalization is essential for obtaining reliable results, which is achieved by using internal control genes, commonly referred to as housekeeping genes. This strategy should also consider variations in RNA input, cDNA synthesis, and PCR efficiency. qRT-PCR normalization required for accurate quantification often relies on a single reference gene, assuming its stable expression across experimental conditions. However, research has shown that reference genes can exhibit variability, which may lead to misinterpretations in gene expression results.[1,2]
This article discusses the principles, methodology, and advantages of the Vandesompele method compared to other commonly used normalization techniques, such as the Livak and Pfaffl methods.
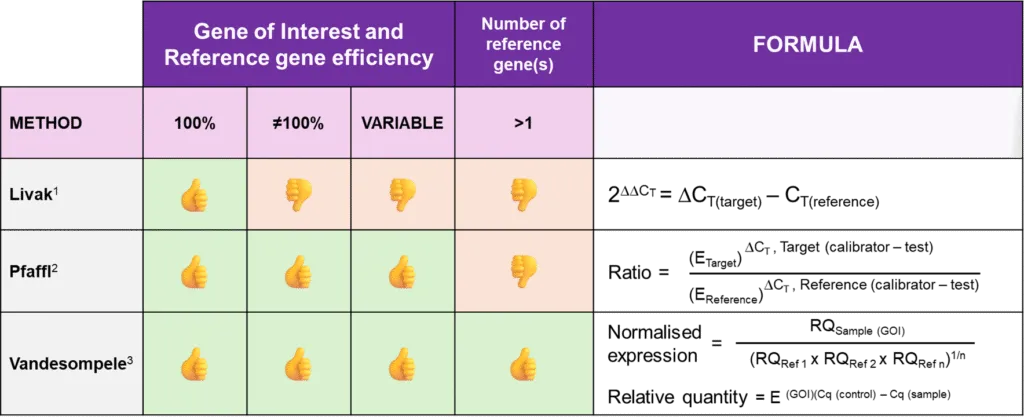
Livak Method (2(-ΔΔCT) method)[3]
Developed by Livak et al. (2001), this method is widely used for relative quantification of gene expression. It assumes 100% efficiency for both the reference gene and the gene of interest (GoI). The expression of the GoI is normalized to a single reference gene and is calculated using the formula: RQ = 2−ΔΔCT
Limitations: This method is only valid if both the reference and target genes have similar amplification efficiencies (~100%). Any deviation in efficiency introduces errors in the final expression levels.
Pfaffl Method (Efficiency-corrected ΔΔCT method)[4]
Recognizing the limitations of the Livak method, Pfaffl (2001) proposed an efficiency-corrected version of the relative quantification formula, which accounts for differences in amplification efficiency.
Limitations: This approach still relies on a single reference gene for normalization, which can lead to errors if that gene is unstable under experimental conditions.
Vandesompele method[5]
To overcome these limitations, Vandesompele et al. introduced an improved normalization strategy in 2002 that incorporates multiple reference genes instead of a single one and their efficiencies, enhancing the accuracy of gene expression quantification. This method minimizes biases caused by the variability of individual reference genes and provides a more stable normalization factor.
Methodology for gene expression normalization using the Vandesompele method
- cDNA synthesis:
Synthesize cDNA from at least two samples using 2 µg of starting RNA in a 20 µL reaction.
The synthesized cDNA should have an effective concentration of 100 ng/μL. - Serial dilution:
Prepare serial dilutions of the cDNA at concentrations of 10, 1, 0.1, and 0.01 ng/µL. - qRT-PCR and standard curve generation:
Perform qRT-PCR on the serially diluted samples.
Construct a standard curve by plotting the average CT values against the logarithm (log10) of the starting cDNA concentrations. - Linear regression:
Perform linear regression on the standard curve to obtain the slope. - Primer efficiency calculation:
Calculate primer efficiency (PE) using the formula: PE(%) = [10(-1/Slope) – 1] x 100.
Convert primer efficiency (CPE) using the formula: CPE = (PE%/100) + 1. - qRT-PCR for experimental samples:
Perform qRT-PCR on control and test samples, including biological replicates, if applicable.
Obtain and analyze average CT values for robust gene expression quantification. - ΔCT calculation:
Calculate ΔCT values by subtracting the sample’s CT value from the mean CT of the control for each gene separately. - Relative Quantity (RQ) calculation:
Determine RQ for each gene using the formula: RQ = CPEΔCT - Reference gene normalization:
Calculate the geometric mean of RQ values for all reference genes. - Normalized gene expression calculation:
Obtain normalized gene expression by dividing RQGoI by the geometric mean of reference genes.
Thus, the Vandesompele method enhances the accuracy of qRT-PCR normalization by leveraging multiple reference genes, making it superior to the traditional Livak (ΔΔCt) and Pfaffl methods. This results in more precise, reproducible, and biologically meaningful gene expression data, making it the preferred choice for quantitative gene expression analysis for qRT-PCR.
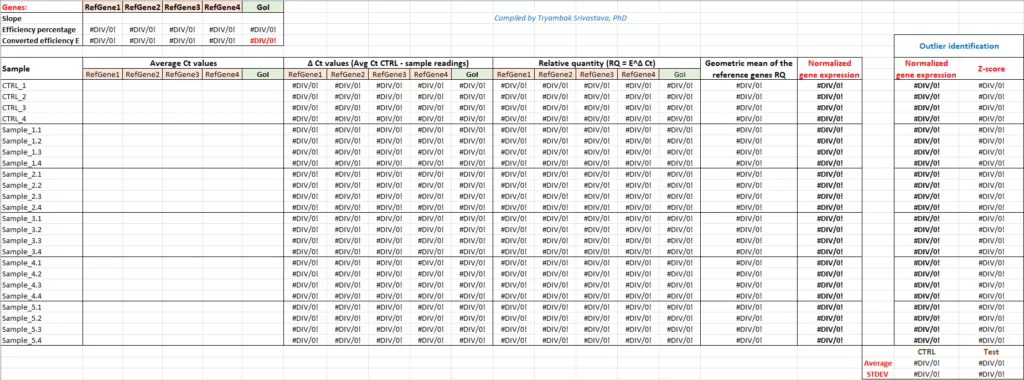
Here is a free MS Excel template for calculating gene expression using this method and finding outliers, if any. Enter your CT values, and it will do the computation for you.
© Tryambak Srivastava
February 08, 2025
Dallas, TX, USA
References:
- Peters IR, Helps CR, Hall EJ, Day MJ. Real-time RT-PCR: considerations for efficient and sensitive assay design. J Immunol Methods 2004;286(1–2):203–17. ↩︎
- Pfaffl MW. A new mathematical model for relative quantification in real-time RT–PCR. Nucleic Acids Res 2001;29(9):e45. ↩︎
- Livak KJ, Schmittgen TD. Analysis of relative gene expression data using real-time quantitative PCR and the 2(-Delta Delta C(T)) Method. Methods 2001;25(4):402–8. ↩︎
- Pfaffl MW. A new mathematical model for relative quantification in real-time RT–PCR. Nucleic Acids Res 2001;29(9):e45. ↩︎
- Vandesompele J, De Preter K, Pattyn F, Poppe B, Van Roy N, De Paepe A, et al. Accurate normalization of real-time quantitative RT-PCR data by geometric averaging of multiple internal control genes. Genome Biol 2002;3(7):research 0034.1-research0034.11. ↩︎